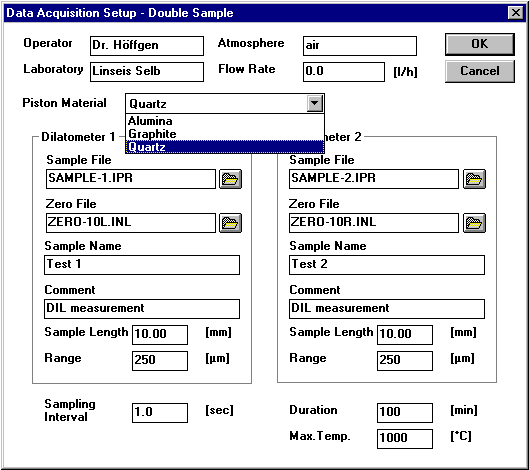
Essential data for each sample test includes; operator, laboratory, atmosphere, gas flow, material, sample file name, zero file name, comments, sample length, measuring range, max. temperature, duration of run, sampling frequency, heating and cooling rates, number of cycles.
All menus are easily understood and intuitive. The software is quickly mastered with minimal training needed.
             LINSEIS Dilatometer Evaluation Protocol

Common data:

-----------------------------------------------------------------
Date/Time:  11/14/99  13:38:42  Sample:     Platinum    10.00 mm
Operator:   Pog                 Reference:  --------     0.00 mm
Laboratory: LINSEIS             Atmosphere: Air          0.00 l/h
Comment:    Calibration         Zero: Null-10   Piston:  Quartz
-----------------------------------------------------------------


Controller parameters:

-----------------------------------------------------------------
Segment | Heating  [K/min] |End temperature [°C]| Dwell time[min]
-----------------------------------------------------------------
   1    |       10.0       |       830.0        |        0.0
   2    |       30.0       |       500.0        |        0.0
-----------------------------------------------------------------


Table of data and coefficients:

Reference temperature for AKt:  20°C
Reference temperature for AKp:  20°C
-----------------------------------------------------------------
   T [°C]   |   dL [µm]  | AKt[E-6/K] | AKp[E-6/K] |  dL/L0 [%]
-----------------------------------------------------------------
    100.0   |     6.94   |     8.68   |     9.66   |    0.069
    200.0   |    16.26   |     9.03   |    10.82   |    0.163
    300.0   |    25.85   |     9.23   |    11.12   |    0.259
    400.0   |    35.49   |     9.34   |    11.40   |    0.355
    500.0   |    45.21   |     9.42   |    11.62   |    0.452
    600.0   |    55.78   |     9.62   |    11.98   |    0.558
    700.0   |    66.33   |     9.75   |    12.34   |    0.663
    800.0   |    77.24   |     9.90   |    12.75   |    0.772
-----------------------------------------------------------------
|
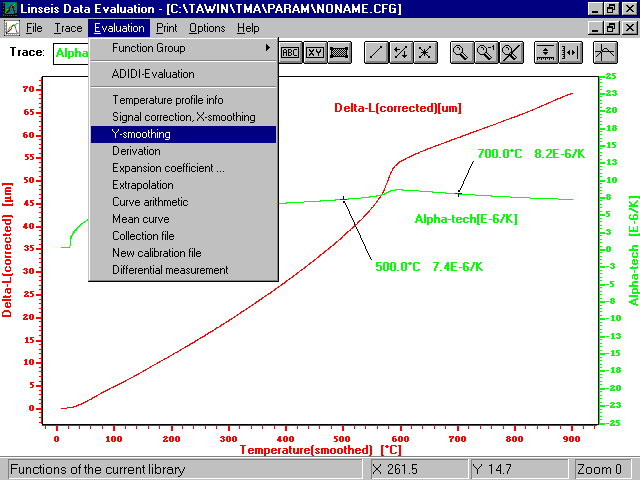
The evaluation is part of the complete windows software, It features a number of functions enabling a full evaluation of all types of data. All evaluation and data collection can be performed simultaneously. Data can be corrected using zero and calibration correction. Data evaluations include: absolute length change, relative length change, and coefficient of thermal expansion. A mean curve with statistical analysis can be performed on multiple curves. Graphical displays can be printed on all windows compatible printers or plotters.
Data can be displayed and printed in a table format. The software also includes an ASCII export feature.
Dilatometer Measuring Systems |
Dilatometer Furnace Programs |
Dilatometer Applications
Information: info@linseis.com
Webmaster: BRT